
Overview
Custom reports can be built for the following modules:
- Activities
- Campaigns
- Contacts
- Organizations
- Expenses
- Invoices
- Jose
- Opportunities
Creating a Report
- Navigate to the Reports module from the left hand navigation menu
- Select the Generate New Report button in the upper right corner
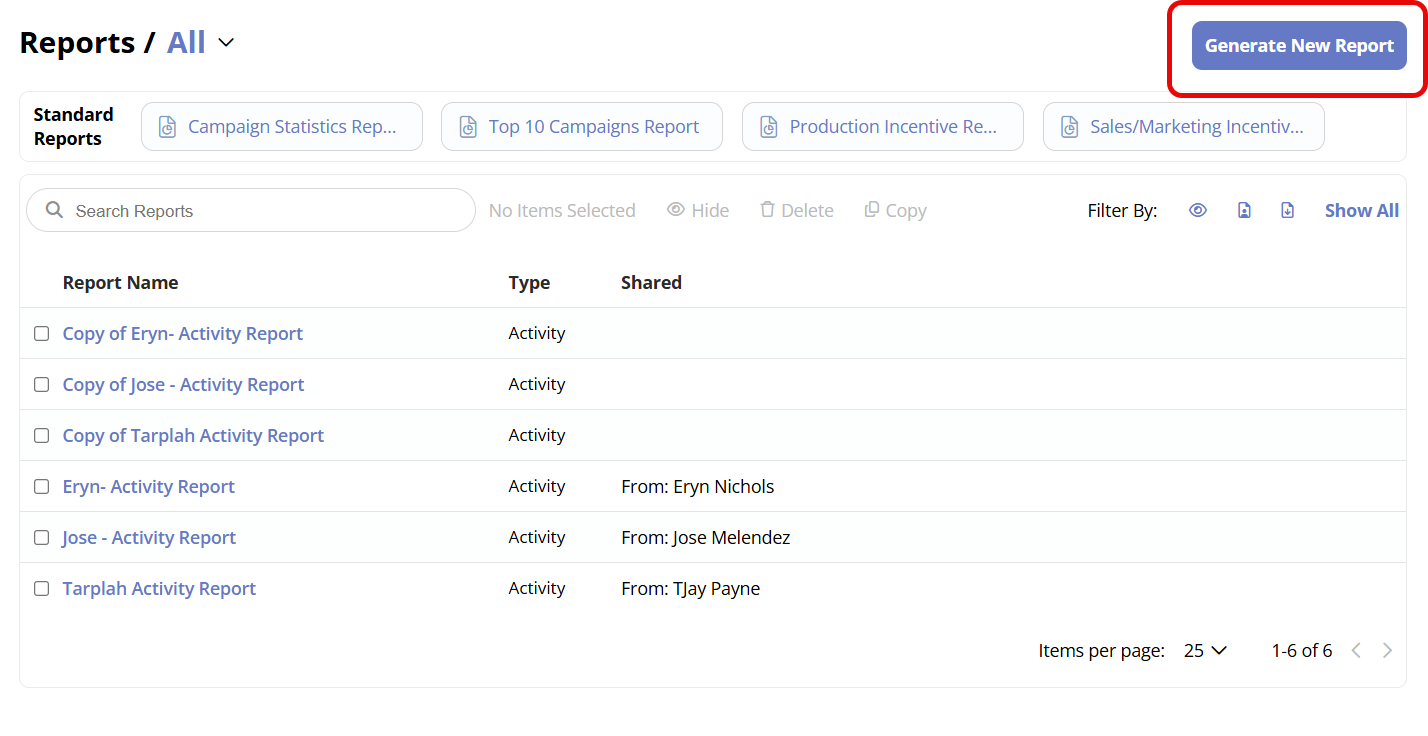
- A popup will appear with Report categories - choose the most appropriate category based on the information you would like to report on (e.g., Activities, Contacts, Jobs, Expenses, etc.)
Adding columns
To select the data fields that will appear as columns in your report:
- Click the desired data field in the "Available Fields" list.
- Click the right chevron/arrow symbol to move the field to the "View Fields" list.

- To select multiple fields simultaneously, hold the CTRL key while clicking the fields.
Filtering your report
Adding filters narrows down the data displayed in the generated report. By default, if no filters are added, the report pulls all items of that specific type (e.g., all invoices, all activities, all contacts, etc.).
Filters are added under the "Field to search" section of the report builder. It is helpful to allude to any filters in the report title for clarity on what data is included or excluded.
Types of filters
The report builder provides several filter types:
- Yes / No Filters: These filters include or exclude data based on a true/false condition.
- Example: Filter by Companies that are active to exclude all inactive companies from the results.

- Example: Filter by Companies that are active to exclude all inactive companies from the results.
- Date Filters: These filters allow you to narrow results down to specific date ranges.
- Choose from pre-generated date conditions.
- Select "Between two dates" for a custom time range.
- Select "Not between two dates" to exclude a custom time range.
- Example: Filter by Companies created within a specific date range.

- Comparison Filters: These are the most common filters and allow for various inclusion/exclusion criteria.
- = (Equals) and NOT (Does Not Equal): Use these to include or exclude specific text or values.
- Example: Contacts: City = New York City
- Example: Contacts with Classification = C3
- >, <, >=, <=: These are best used with numerical values
- Example: Filter a report to show Organizations with >= 15 days since the last activity was added.

- Example: Filter a report to show Organizations with >= 15 days since the last activity was added.
- IS NULL: Use this to include results where information is missing in the specified field.
- Example: See all Companies that do not have a Route assigned.
- IS NOT NULL: Use this to exclude any data that is not filled out in the specified field.
- = (Equals) and NOT (Does Not Equal): Use these to include or exclude specific text or values.
Grouping your data
Grouping is a powerful way to organize your data and create subtotals within the report.
- You can group by any of the fields available in the report.
- You can create multiple levels of groupings.

Building calculations
Simple calculations can be automatically performed by CRM when the report is generated. There are four pre-set report calculations available:
- Average (Avg)
- Minimum (Min)
- Maximum (Max)
- Sum

Questions? Contact Us
This article is meant to serve as a reference only and is not a substitute for training. If you are interested, feel free to check out our weekly Q&A sessions hosted by our CRM experts.